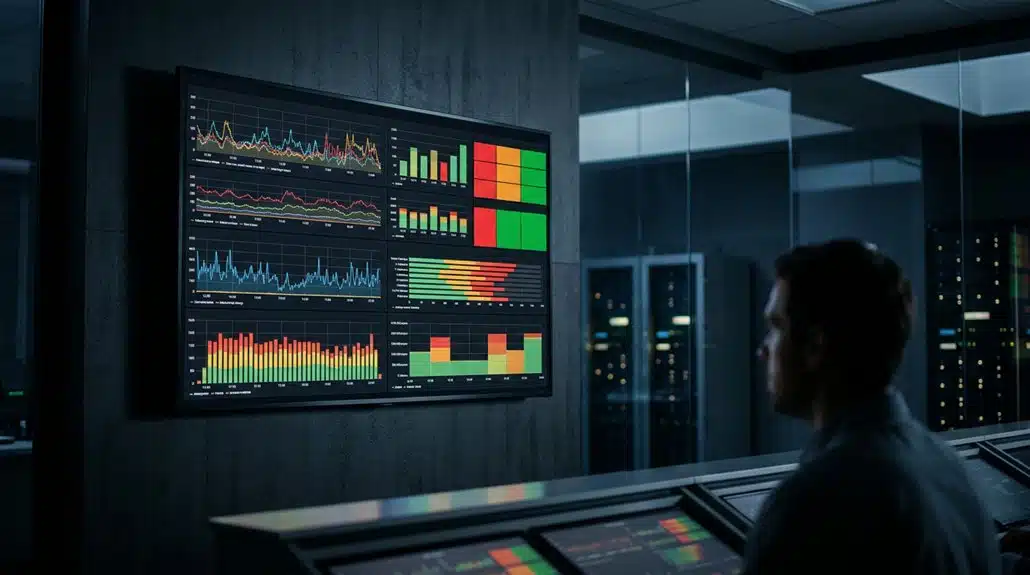
You can display real-time metrics using Grafana on digital signage for better decision-making and engagement. Grafana offers dynamic dashboards with customizable visualizations and integrates with various data sources. Secure your data with API tokens and SSO with MFA. Optimize displays by adding “&kiosk” to URLs, and guarantee dashboards fit screen dimensions and refresh rates. Streamline integration using tools like Fugo without sacrificing security. Keep metrics updated for timely insights. There’s more to discover.
Key Takeaways
- Grafana integrates with digital signage using Fugo for seamless, secure data display without repeated logins or public links.
- Real-time metrics enhance decision-making and engagement, ensuring timely updates to avoid stale information on digital signage.
- Customize Grafana dashboards with “&kiosk” mode for clean, distraction-free displays tailored to fit screen dimensions and refresh rates.
- Use read-only service tokens and IP restrictions on digital signage platforms to secure data access and maintain confidentiality.
- Utilize customizable visualizations like gauges and heat maps to effectively convey key insights and engage viewers.
Why Use Grafana for Real-Time Metrics?

Why should you consider using Grafana for real-time metrics? Grafana’s advantages are clear: its open-source platform offers unparalleled real-time feedback through dynamic dashboards that integrate with 51+ data sources like Prometheus and InfluxDB. This allows you to centralize essential data in one location, providing immediate access to key performance indicators and system health.
Customization is another Grafana advantage. You can tailor the presentation of metrics using different visualization types—gauges, heat maps, bar graphs—suiting specific audience needs. Grafana’s alerting features enable you to set thresholds, receiving timely notifications about issues or trends.
When integrated with digital signage, Grafana enhances visibility by showcasing real-time metrics across your workplace, boosting awareness and decision-making. Ultimately, Grafana streamlines data interpretation, creating an effective monitoring environment.
Evaluating Security and Compatibility for Digital Signage Platforms
While Grafana offers significant advantages for real-time metrics, deploying it on digital signage platforms requires a careful evaluation of security and compatibility. Establishing robust security measures like Single Sign-On (SSO) and Multi-Factor Authentication (MFA) is vital to protect sensitive data. Here’s what you need to take into account:
- Access Control: Implement service accounts with read-only API tokens to secure data access without exposing sensitive information.
- Device Compatibility: Platforms like Fugo support a wide range of devices—from smart TVs to HDMI-compatible players—providing flexibility.
- Integration Ease: Opt for tools like Fugo that streamline Grafana dashboard display without public links or repeated logins.
- Authentication Methods: Be aware of each platform’s authentication limitations, like avoiding direct user credential requests in Yodeck.
These steps guarantee secure and compatible Grafana deployment.
Configuring Your Grafana Dashboard for Display

To configure your Grafana dashboard for digital signage, start by setting up a service account token for secure, uninterrupted access. Use the Burp Suite Navigation Recorder to streamline the authentication process and automate dashboard viewing. Append “&kiosk” to your dashboard URLs to clean up the display, and adjust settings to match screen dimensions and refresh rates.
Dashboard URL Configuration
Successfully configuring your Grafana dashboard for display on digital signage hinges on crafting the correct URL. Focus on dashboard customization by ensuring it meets the visual requirements of your display. Additionally, streamline the process by fine-tuning URL parameters. Here are some steps to follow:
- Append `&kiosk` Mode: Enhance viewing by adding `&kiosk` to your URL for a clean, distraction-free display.
- Adjust Time Ranges: Customize the URL parameters to reflect the desired time range, influencing the data shown.
- Security Measures: Opt for a service account token, avoiding embedding sensitive credentials directly in the URL.
- Test Display: Verify how your dashboard looks on the signage screen, ensuring all visuals render correctly and refresh as intended.
Authentication Setup Requirements
After configuring your Grafana dashboard’s visual aspects for digital signage, focus on setting up authentication correctly to guarantee security and reliability. Start by logging into your Grafana account to create a service account. This step is essential for obtaining a secure service account token, needed for authenticating multiple screens. For versions 5.2 or older, you can use an API key instead. Make sure the token or API key has appropriate read-only permissions, allowing access to dashboards without exposing sensitive data. Configure your authorization headers accurately with the generated service account token. This setup guarantees only entitled systems can access your Grafana dashboards when displaying metrics on digital signage, streamlining secure integration into your digital communication ecosystem.
Display Optimization Tips
While ensuring your Grafana dashboard is visually appealing on digital signage, enhancing its functionality is key. Start by focusing on effective layouts and practical configuration. Here are some tips to get you started:
- Optimize Display: Use the `&kiosk` URL parameter to remove unnecessary elements, creating a cleaner look and enhancing readability.
- Adjust Panel Sizes: Configure panel dimensions to prioritize critical data, ensuring it remains visible and understandable from varying distances.
- Refresh Rate: Set a minimum dashboard refresh rate for real-time updates, keeping the content actionable.
- Visual Elements: Incorporate engaging elements like heat maps and gauges tailored for screen formats to improve quick insights.
Seamlessly Connecting Grafana to Your Signage

To integrate Grafana with your digital signage, use tools like Fugo or Screenly to efficiently bridge your dashboards with displays. Automate data display by appending &kiosk to the dashboard URL, optimizing it for aesthetic and user-friendly views. Secure these connections by configuring read-only service tokens in Grafana and setting up advanced header settings for authentication.
Integrating Grafana With Signage
Efficiently integrating Grafana with your digital signage involves leveraging API tokens and service accounts, ensuring secure and real-time metric displays on screens. Use display frameworks to embed Grafana’s insights, optimizing content strategies for impactful data presentation. Here’s how you can integrate seamlessly:
- API Tokens & Service Accounts: Use these to establish secure connections between Grafana and signage platforms like Screenly or Fugo.
- Dashboard Configuration: Share URLs with query parameters, such as &kiosk, to tailor refresh rates and display settings.
- Customizable Views: Adjust dashboards to reflect up-to-date, relevant metrics to the audience, while maintaining security.
- Enhanced Integration Tools: Utilize tools like Fugo for automatic updates, ensuring dashboards push to screens without extra effort.
These steps help keep your metrics current and your data protected.
Automating Data Display Effortlessly
Integrating Grafana with your digital signage is just the beginning. Automating your dashboard display is key to achieving display efficiency. Tools like Fugo connect Grafana Cloud to TVs, providing real-time metrics without constant logins. Start by creating a read-only service account token in Grafana to securely access your dashboards. Use Burp Suite Navigation Recorder for simplified script recording, ensuring a seamless setup.
Customization options are essential—adjust data refresh rates and configure playlists tailored to your team’s needs. Enhance your display by appending URL parameters like &kiosk for a prime viewing experience. Remember to format dashboards engagingly so key metrics captivate your audience.
| Tool | Purpose | Benefit |
|---|---|---|
| Fugo | Connects Grafana to TVs | Real-time data visibility |
| Burp Suite | Simplifies script recording | Fast and efficient setup |
| URL Parameters | Customize display view | Prime viewing experience |
Securing Data Connections Effectively
While connecting Grafana to your signage, prioritizing data security is vital. Securing your connections involves a few key practices.
- API Token Security: Use encrypted, read-only API tokens via Grafana’s service accounts to enhance security. Limit tokens’ permissions to only what’s necessary.
- SSO Implementation: Implement Single Sign-On (SSO) with Multi-Factor Authentication (MFA) to strengthen defense against unauthorized access to dashboards.
- Access Restrictions: Configure IP address restrictions so only specified devices on your network can retrieve data from your Grafana instance.
- Data Transmission Security: Verify integration with external services uses HTTPS to protect data during transmission. Regular plugin updates are significant; keep them current to safeguard against vulnerabilities and maintain secure, reliable connections.
Enhance Engagement With Optimized Dashboards
Refined dashboards in Grafana serve as powerful tools for enhancing engagement, especially when utilized in digital signage. By focusing on dashboard aesthetics, you can tailor displays to capture attention and communicate information effectively. Various visualization types like heat maps and gauges present dynamic representations of live data, which are essential for displaying real-time metrics. User feedback plays a vital role in refining these dashboards, ensuring they meet the specific needs of your audience. Customizable content options allow for targeted information display, relevant to specific teams or audience segments. Employing advanced features like user hierarchies and targeted playlists helps provide the right data to the right individuals at ideal times, reducing alert fatigue and showcasing important performance trends and anomalies.
Keep Your Grafana Metrics Updated
To fully leverage refined dashboards on digital signage, keeping your Grafana metrics updated is vital for real-time insights. Regular updates guarantee you have the most timely data, enhancing decision-making processes. Here’s how to maintain effective real-time updates:
- Configure Auto-Refresh: Set Grafana dashboards to update automatically, whether it’s every few seconds or daily, according to what best suits your needs.
- Use API Tokens: Employ Grafana’s API tokens for secure, consistent data access, especially when integrating with digital signage solutions.
- Customize Dashboard Layouts: Tailor the dashboard layout for peak visibility on digital signage, guaranteeing that key metrics are front and center.
- Choose Compatible Platforms: Integrate with platforms like Fugo, which supports automated updates, keeping data relevant and fresh effortlessly.
Frequently Asked Questions
What Hardware Requirements Are Needed to Run Grafana on Digital Signage?
You’d need hardware that meets Grafana requirements like a processor supporting server-grade tasks and enough RAM. For digital signage hardware, guarantee a reliable display infrastructure and a robust network connection to stream real-time data efficiently.
How Can I Troubleshoot Display Issues With Grafana Dashboards on Signage?
Check your network connectivity first. If it’s stable, confirm the data refresh rate matches your setup specifications for ideal performance. Verify the screen resolution settings align with Grafana’s dashboard requirements to prevent display distortions.
Can Grafana Integrate With Existing Digital Signage Management Systems?
Yes, Grafana integrations with digital signage management can be as smooth as butter. It’s vital to guarantee digital signage compatibility by checking supported APIs, ensuring connection stability, and customizing dashboards to suit your existing signage infrastructure.
Are There Recommended Best Practices for User Accessibility on Digital Signage?
Focus on optimizing color contrast and adjusting font size for readability. Follow established accessibility guidelines to guarantee inclusive design. Regularly gather user feedback to refine the experience, enhancing accessibility and meeting diverse user needs effectively.
How Do I Manage Permissions for Grafana Dashboards Displayed Publicly?
Think of permissions as the keys to your kingdom. Manage user roles to control public access, adjust security settings for safe display options. Utilize dashboard sharing features and guarantee timely content updates to maintain a secure environment.
Conclusion
You’ve now mastered using Grafana for real-time metrics on digital signage. Remember, it’s like having your digital metrics at the touch of an Atari joystick. With seamless integration and ideally configured dashboards, your engagement is ready to launch into orbit. Keep security checks in place and confirm your dashboards are frequently updated to drive insightful decisions. You’ve set the stage to dynamically engage, staying ahead in the ever-evolving game of digital displays.