
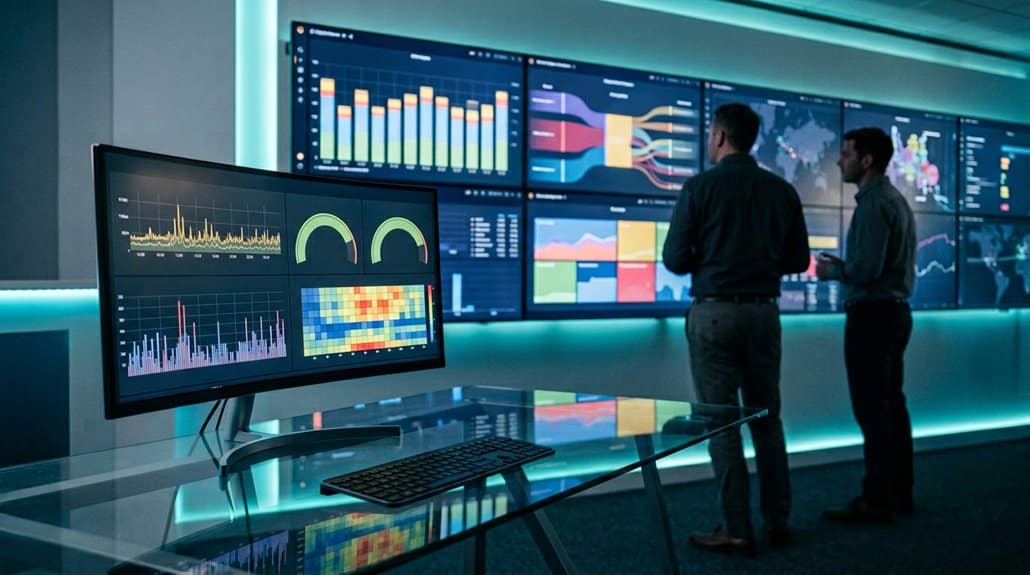
You’ll find that Grafana transforms operational visibility on digital signage by automating data management and simplifying metrics analysis. It integrates with tools like Salesforce and Google Sheets, providing real-time access to essential metrics via customizable dashboards. Grafana fosters a metrics-driven culture and scales across platforms, ensuring your data is always accurate and actionable. Discover how integrating these features can further elevate your operational strategies and insights.
Key Takeaways
- Grafana integrates with multiple data sources for comprehensive insights on digital signage.
- Real-time access to crucial metrics enhances decision-making and operational visibility.
- Customizable dashboards display relevant data efficiently, improving clarity and focus.
- Automation and scalable solutions promote a metrics-driven culture for operational efficiency.
- Secure access controls ensure data integrity and compliance on digital signage.
Understanding Grafana’s Role in Operational Visibility

Grafana acts as a key enabler of operational visibility by simplifying how you manage and analyze data. With its robust Grafana integration capabilities, you seamlessly consolidate information from platforms like Salesforce and Google Sheets, enhancing your data source performance. This isn’t just about connecting systems; it’s about ensuring real-time access to crucial metrics on digital signage screens, fostering a responsive work environment. Dynamic dashboards eliminate static reports, alleviating alert fatigue, enabling you to focus on what’s important. By customizing these dashboards, you can cater to diverse user needs, promoting transparency and aligning organizational goals. The result? A metrics-driven culture that prioritizes automation and scalability, optimizing communication and engagement while keeping teams aligned with up-to-date insights across departments.
Transforming Data Into Visual Insights With Grafana
Visualizing data effectively transforms how insights are derived and decisions are made. Grafana leads the way with its capability to convert complex datasets into intuitive visual insights. By leveraging advanced visualization techniques and robust data integration, you can consolidate data from over 150 plugins into a cohesive dashboard that enhances operational transparency. This enables you to maintain focus on critical metrics, ensuring that your digital signage always displays the most relevant information without manual intervention.
Grafana transforms complex datasets into intuitive visual insights, enhancing decision-making through advanced visualization and seamless data integration.
- Real-time Display: Dashboards auto-refresh for continuous visibility of KPIs.
- Centralized Metrics: Integrate diverse data sources into one streamlined interface.
- Cultural Shift: Encourages a data-driven environment by fostering increased awareness and alignment.
With Grafana, scalable, automation-driven insights become a reality, amplifying your decision-making prowess.
How to Customize Grafana Dashboards for Visibility Impact
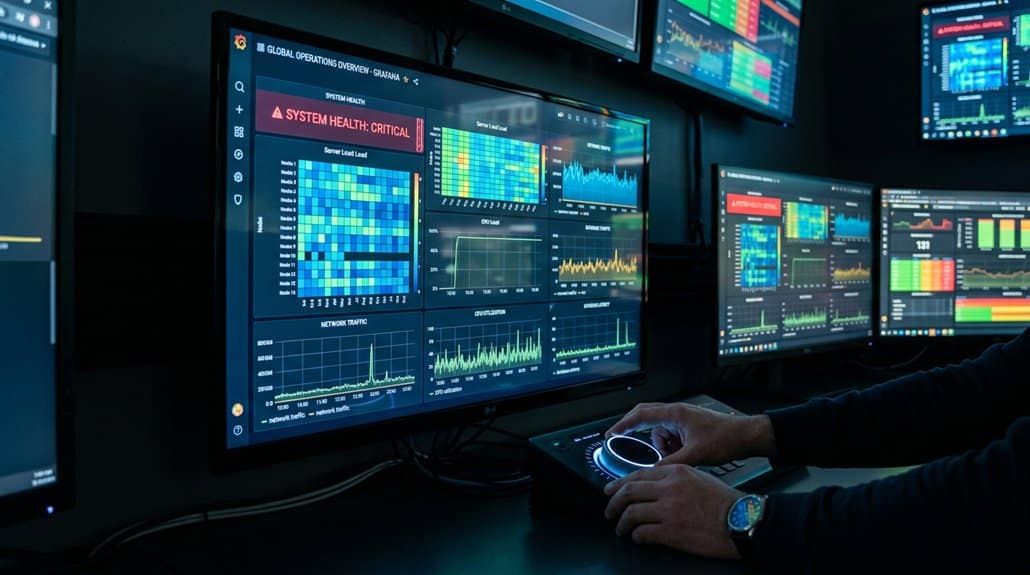
To enhance dashboard clarity with Grafana, you can leverage the Design Studio to resize, crop, and position elements for maximal impact on digital signage displays. Tailor your visual elements to optimize display configuration, ensuring your team sees the most pertinent metrics without distraction and in a timely manner. By implementing encrypted, read-only API tokens and setting flexible refresh rates, you’ll secure your customization efforts while maintaining the accuracy and relevance of the data presented.
Enhance Dashboard Clarity
Customizing your dashboards for better visibility can vastly improve how effectively your team processes essential metrics. Focusing on dashboard aesthetics and visual hierarchy can lead to cleaner, more impactful displays, ensuring that critical data takes priority on screens. By leveraging Grafana’s customizable features, you can streamline information delivery:
- Design Studio: Adjust dimensions, colors, and visual elements to enhance dashboard aesthetics, making key metrics more readable.
- Dynamic Elements: Integrate ticker text and QR codes to keep displays interactive, while key data remains consistently visible.
- User Hierarchies: Implement access controls to deliver personalized content to specific audiences, optimizing the experience for everyone.
Adopting these strategies promotes a metrics-driven approach, aligning your displays with the dynamic needs of your organization.
Optimize Display Configuration
Building on the foundation of enhanced dashboard clarity, Optimize Display Configuration focuses on customizing Grafana dashboards for a significant visibility impact. With flexibility at its core, you can adjust dashboard size and layout to fit large-format displays, ensuring critical metrics are at the forefront for all employees. Leverage Grafana’s Design Studio to refine display aesthetics, adding branding elements and configuring visual components to boost clarity and engagement. Tailor dashboards for targeted user accessibility, directing pertinent data to specific teams via designated screens. Balance data influx by fine-tuning refresh rates—achieving real-time insight without overwhelming users. With options like titles, ticker text, and QR codes, you’re equipped to design dashboards that are both informative and visually striking.
Enhancing Team Collaboration Through Real-Time Data
When you leverage real-time Grafana dashboards, you’re not just monitoring metrics; you’re fostering a data-driven culture that enhances engagement across the workforce. By making critical data accessible to everyone, employees at all levels can contribute to informed decisions, aligning efforts toward shared goals. This approach scales collaboration efficiently, ensuring your team is poised to respond swiftly to operational challenges and optimize performance metrics collectively.
Fostering Data-Driven Culture
- All employees, regardless of their position, gain equal access to essential metrics, promoting transparency and collaboration.
- Teams enjoy a shared understanding of operational insights, boosting cross-departmental cooperation in addressing challenges swiftly.
- Data visuals can be swiftly updated, facilitating immediate feedback and enabling proactive decision-making.
This level of transparency aligns teams with organizational goals and leverages real-time insights to bolster synergy, automating workflows, and scaling collaboration efforts. By embedding these practices, you guarantee every department is primed for enhanced coordination in achieving business objectives.
Enhancing Workforce Engagement
As transparency aligns with organizational goals, enhancing workforce engagement through real-time data becomes paramount. Utilizing digital signage with Grafana dashboards, you can display key performance metrics, ensuring data transparency and fostering employee motivation. This approach empowers frontline workers by providing equal access to essential information, aligning them with broader objectives. It supports a culture of inclusive discussions and efficient collaboration, as everyone views critical data in real time.
Real-time insights promote immediate feedback and strategic adjustments, keeping teams adaptive and cohesive. Dynamic dashboards celebrate individual and team achievements, fueling motivation and a sense of community. As operational performance updates continuously on digital displays, your workforce stays engaged with the company’s progress, ready to respond effectively to emerging challenges.
Seamlessly Connect Grafana With Your Tools

Leveraging Grafana’s integration prowess, you can seamlessly connect your existing tools through its extensive range of over 150 plugins and APIs, facilitating a streamlined flow of data visualization from various platforms like Salesforce and Google Sheets. This connectivity enhances:
- Grafana plugins for efficient data sourcing and real-time dashboard updates, providing up-to-date operational metrics without manual input.
- API integrations that support tailored content management and user hierarchies, guaranteeing dashboards are shared with relevant teams only.
- Business flexibility, allowing for the incorporation of new tools and evolving integrations to match changing organizational requirements.
Grafana’s centralized data management simplifies workflows, enabling you to view diverse metrics within a single, accessible dashboard. This scalability guarantees your digital signage always reflects current data, enhancing efficiency and decision-making.
Keeping Your Digital Signage Secure and Compliant
While seamless integration with tools enhances operational visibility, safeguarding your digital signage is key to maintaining data integrity and compliance. Grafana fortifies data security by using encrypted, read-only API tokens for service accounts. Implementing Single Sign-On (SSO) and Multi-Factor Authentication (MFA) helps you protect against unauthorized access to sensitive information. Compliance measures are bolstered as Grafana avoids public URLs and unencrypted login credentials, thereby reducing security risks associated with dashboard exposure. By enabling IP address restrictions, you can control and limit who accesses the data. Additionally, leveraging cloud encryption and unique keys guarantees safe data transmission, keeping you aligned with data protection regulations. Grafana’s robust security framework scales effortlessly, providing a secure and compliant digital signage experience.
Frequently Asked Questions
What Are the Hardware Requirements for Deploying Grafana on Digital Signage?
To guarantee seamless Grafana installation on digital signage, you’ll need a dual-core CPU, 2GB RAM, and 10GB storage. Prioritize digital signage compatibility to maximize automation and scalability while effectively tracking metrics and enhancing operational efficiency.
How Does Grafana Handle High-Resolution Display Outputs?
You’ll find Grafana handles high-resolution display outputs by utilizing advanced resolution management and display optimization techniques. It’s automation-focused and metrics-driven, ensuring scalable solutions for rendering crisp, precise visuals across various displays without losing performance efficiency.
Can Grafana Dashboards Be Displayed Offline on Digital Signage?
Yes, you can display Grafana dashboards offline on digital signage using Grafana caching. Automating this guarantees you’re not losing insights even without connectivity, keeping metrics visible and supporting your scalability with efficient offline dashboards.
What Are the Initial Setup Steps for Grafana on Digital Signage?
Start by ensuring data source integration to collect the needed metrics efficiently. Configure user permission management for secure access and scalability. Automate dashboard deployment on signage systems to streamline processes and optimize operational delivery.
How Can Grafana’s Performance Be Optimized for Large-Scale Digital Signage Networks?
To optimize Grafana’s performance for large-scale digital signage networks, focus on efficient data aggregation and streamlined alert management. Automate processes, prioritize metrics-driven insights, and guarantee scalability to handle massive data influx and dynamic operational demands effectively.
Conclusion
Imagine your digital signage network as a vibrant city, bustling with data flowing like streams of neon. With Grafana, you’re not just observing; you’re orchestrating. You’re crafting a symphony of metrics, each note revealing insights. Dashboards transform into command centers, enabling scalability without compromise. As your team collaborates effortlessly in real-time, compliance and security dance in synchronization. This is how operational visibility evolves; a dynamic, metrics-driven journey toward enhanced automation and seamless connectivity.