Real-time data visualization on corporate signs transforms static metrics into dynamic insights, driving decision-making and boosting engagement across your organization. Leveraging tools like Sprinklr Display, you can integrate over 30 digital channels, create custom visualizations, and guarantee secure data flow with flexible security options. Advanced features like touchscreen controls, remote management, and automatic updates via integrations with Tableau and Power BI, make your data actionable immediately. This method transforms raw data into compelling visual stories, guaranteeing your team always has the most relevant information. Explore how these capabilities can streamline your workflow and enhance communications.
Table of Contents
ToggleKey Takeaways
- Real-time data visualization converts static data into dynamic insights for timely decision-making.
- Digital signage integrates multiple data sources for consistent and up-to-date visual storytelling.
- Sprinklr Display offers over 40 design widgets for personalized and engaging data presentations.
- Automation ensures continuous relevance of content by eliminating manual updates and reducing operational costs.
- Centralized display management with secure options maintains data integrity and content continuity.
Business Value of Real-Time Data
Real-time data visualization provides immense business value by maintaining data's relevance and actionability. With 69% of business data losing value quickly, it's vital to utilize real-time data to uphold its importance. By using real-time data visualization, you can convert static numbers into dynamic insights that drive decision-making. Digital signage plays a crucial role here, converting raw data into visually compelling stories displayed on screens in corporate environments.
Unified-CXM captures data across 30+ digital channels, offering a thorough data source for these visualizations. This ensures that the information you're working with is current and relevant. Meanwhile, Sprinklr Display enhances this process by transforming real-time content into impactful visualizations. By using over 40 design widgets, you can create engaging and informative digital signage that highlights essential brand stories.
Implementing real-time data visualization through digital signage means you can present live metrics and updates to customers, stakeholders, and internal teams, guaranteeing everyone has access to actionable insights. This approach not only keeps your data fresh but also supports informed decision-making across your organization. Ultimately, leveraging real-time data visualization can greatly enhance your business's responsiveness and agility.
Insights-Driven Experiences
Harnessing the power of real-time data visualization on corporate signs can transform raw data into actionable insights, driving more informed decisions and enhancing overall business performance. By leveraging insights-driven experiences, you can deliver real-time data to customers, stakeholders, and internal teams through a unified solution like Sprinklr Display.
Sprinklr Display offers robust capabilities for various use cases, including command centers, retail spaces, stadiums, and broadcast TV. It integrates over 30 digital channels, ensuring extensive coverage and seamless data delivery. The platform's exceptional editing experience allows you to handle custom design needs effortlessly, creating impactful visualizations that resonate with your audience.
Here's a quick comparison of key features:
| Feature | Benefit | Use Case |
|---|---|---|
| Real-Time Data Delivery | Immediate insight generation | Command Centers |
| Multi-Channel Integration | Broad reach and consistency | Broadcast TV |
| Custom Design | Tailored visual impact | Retail Spaces |
| Unified Solution | Streamlined data management | Stakeholder Communication |
| Expert Support | Goal-specific visualization | Personalized Demos |
Requesting a demo of Sprinklr Display can provide you with a personalized experience, demonstrating how impactful real-time data visualization on corporate signs can be. This approach not only enhances business performance but also fosters a data-driven culture within your organization.
Compelling Data Storytelling

Impactful data storytelling transforms intricate analytics into engaging narratives that drive decision-making and enhance user engagement. By leveraging real-time data visualization, you can convert raw data into digestible insights, making it easier for stakeholders to understand key metrics and trends. Sprinklr Display, with its 40+ design widgets, allows you to create unique and influential visual communication that goes beyond traditional dashboards.
You can stack these widgets to develop complex visualizations that are not only visually appealing but also informative. This stacking capability guarantees that you convey multiple data points in a cohesive and all-encompassing manner. With intuitive tools, you can effortlessly create branded experiences, turning ordinary data into compelling stories that resonate with your audience.
Moreover, transforming Customer Experience Management (CXM) data into visual narratives is essential for impactful communication. Sprinklr Display offers a top-tier editing experience, enabling you to customize designs according to your specific storytelling needs. Personalized storytelling through real-time data visualization guarantees that your message is not only seen but also understood and acted upon.
In essence, impactful data storytelling and real-time data visualization are vital for effective visual communication, driving better business decisions and enhancing user engagement.
Engaging Audiences Anywhere

With versatile configurations and seamless integration with tools like Tableau and Power BI, Sprinklr Display empowers you to engage audiences effectively across various environments. Whether in retail spaces, corporate lobbies, or command centers, Sprinklr Display's robust support for real-time data visualization guarantees your information is always accurate and up-to-date.
The integration with Tableau and Power BI allows for automatic updates, ensuring that your displays reflect the latest data insights without manual intervention. This enhances both the accuracy and relevance of the information presented, making it easier for your audience to stay informed.
Interactive features such as touch screen controls and remote management capabilities enable dynamic engagement. Audiences can interact directly with the data, drilling down into specifics or customizing views to meet their needs. This interactivity fosters a more engaging and informative experience.
Additionally, compatibility with most browsers guarantees that Sprinklr Display operates seamlessly across various devices, broadening accessibility. Partnerships with industry leaders like Samsung and LAVA Controls guarantee high-quality content delivery, maximizing the visual impact of your real-time data visualization. By leveraging these advanced features, you can create compelling, data-driven narratives that capture and maintain audience attention anywhere.
Secure Data Visualization
To guarantee secure data visualization, you can leverage flexible security options tailored to different scenarios. Additionally, content continuity is maintained even during internet outages, ensuring uninterrupted displays. Centralized display management with tools like Display Manager allows for efficient oversight and control.
Flexible Security Options
Tailored security options guarantee data protection and integrity across various scenarios in real-time data visualization on corporate signs. By customizing security measures to specific requirements, you safeguard that your data remains secure and accurate. Centralized management through tools like Display Manager allows you to monitor and control all displays effortlessly. This system lets you oversee security settings across multiple signs from a single interface, offering a streamlined approach to maintain data integrity.
Sprinklr, known for its robust social listening capabilities, underscores the importance of reliable data visualization. When you choose a platform trusted by large companies for social media management, you're leveraging proven security and reliability. Different scenarios—whether high-traffic locations or sensitive information displays—are addressed with adaptable security options. This flexibility allows you to meet diverse needs without compromising data safety.
Furthermore, real-time updates and automatic adjustments guarantee that your corporate signs display the most current data securely. With these measures, you prevent unauthorized access and data breaches, maintaining the trust of your audience. To summarize, flexible security options are essential for protecting and managing your data effectively in real-time visualization environments.
Content Continuity Assurance
Maintaining content flow in secure data visualization on corporate signs involves robust measures to sustain uninterrupted display even during internet outages or disruptions. By integrating real-time information and leveraging advanced digital signage technologies, you can guarantee that essential updates remain visible to your audience without any interruptions.
To achieve this, you need to employ failover systems that switch to preloaded content when the internet connection fails. This approach allows the digital signage to display relevant information continuously, ensuring content flow. Additionally, data caching mechanisms store frequently updated data locally, enabling the sign to pull from these caches instead of relying solely on a live internet connection.
Security is another vital aspect. By utilizing encrypted data streams and secure access protocols, you guard sensitive corporate information against potential breaches while maintaining the integrity of your real-time information. Platforms like Sprinklr exemplify this by offering robust security measures and reliable data visualization, trusted by large companies for their social media management and secure digital signage needs.
Incorporating these measures guarantees that your digital signage delivers uninterrupted, secure, and real-time updates, maintaining the flow of information even in less-than-ideal network conditions.
Centralized Display Management
Centralized display management guarantees safe data visualization by utilizing platforms like Sprinklr Display, which provides flexible security options to maintain data integrity and uninterrupted content flow. Leveraging a digital signage system through centralized management allows you to seamlessly monitor and control content on corporate signs, even during internet disruptions. Sprinklr Display is recognized for its robust security features, making it a trusted choice for large enterprises needing real-time metrics.
Centralized management ensures your digital signage system remains safe and operational. With Sprinklr Display, you can efficiently manage and update content across multiple displays from a single dashboard. This capability is essential for maintaining consistent, secure communication within your organization.
Here's a quick overview of the benefits:
| Feature | Benefit | Impact on Business |
|---|---|---|
| Flexible Security Options | Tailored protection for data | Maintains data integrity |
| Centralized Dashboard | Simplified display management | Streamlines operations |
| Real-Time Metrics | Immediate insights on performance | Informed decision-making |
| Offline Content Management | Continuity during outages | Uninterrupted content flow |
Managing Data Overload
Given the sheer volume of data generated daily, effectively managing data overload is vital to prevent valuable insights from being lost. With an estimated 463 exabytes of data created every day by 2025, dealing with this influx requires robust strategies. Real-time data visualization emerges as an essential tool in managing data overload. By transforming overwhelming data into manageable insights, you can make informed decisions quickly.
Real-time data visualization on corporate signs simplifies complex information, making sure that critical data is not only accessible but also comprehensible. Here's how you can manage data overload effectively:
- Filter Unnecessary Data: Identify and eliminate non-essential data to focus on what truly matters.
- Leverage Automation: Automate data collection and processing to reduce manual workload and minimize errors.
- Prioritize Data Sources: Rank data sources by relevance to make certain that the most critical information is highlighted.
- Use Dashboards: Implement dashboards for real-time monitoring, offering a snapshot of key metrics at a glance.
- Visualize Trends: Utilize data visualization to spot trends and patterns swiftly, aiding in proactive decision-making.
Importance of Data Visualizations
Harnessing real-time data visualization on corporate signs plays an essential role in transforming raw data into actionable insights. By converting complex datasets into easily understandable visual formats, you streamline workplace communication, making it easier for team members to grasp vital information quickly. Real-time data visualization guarantees that data remains relevant, addressing the concerning statistic that 69% of business data loses its value in-market.
Corporate signs equipped with real-time data visualization tools enhance decision-making processes by presenting up-to-date information that's immediately accessible. This enables you to act on the most current data, driving informed actions and decisions. Utilizing over 40 design widgets, you can create compelling visuals that not only tell important brand stories but also maintain a balance of form and function.
The right visuals can break down barriers in communication, ensuring that everyone in the workplace is on the same page. Purposeful visuals in data visualization allow you to present data in a manner that is both engaging and informative. This enhances your ability to make strategic decisions, ultimately benefiting the overall efficiency and productivity of your organization.
Workplace Digital Signage
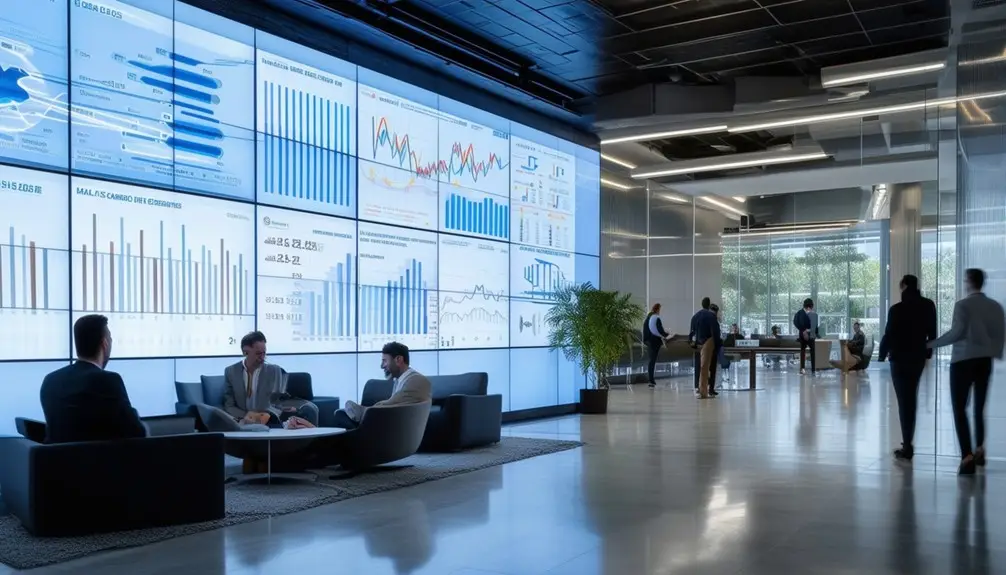
Workplace digital signage enhances employee engagement by presenting real-time metrics and progress updates directly on screens. This approach streamlines communication by transforming complex data into visually compelling graphics, making it easier for employees to grasp vital information at a glance. By integrating digital signage software solutions with various data sources, you can make sure that your workplace digital signage delivers up-to-date information on essential aspects like manufacturing processes and inventory management.
Real-time content for digital signage not only helps employees monitor their performance goals but also allows them to adjust their workload accordingly. This fosters an environment of transparency, trust, and enhanced productivity. Here's how workplace digital signage can transform your organizational communication:
- Instant performance metrics: Display real-time data on sales, production, or other key performance indicators.
- Visual data integration: Convert complex data sets into intuitive charts and graphs.
- Up-to-date information: Keep employees informed with the latest updates on inventory and processes.
- Enhanced transparency: Promote a culture of openness by sharing essential data with your team.
- Improved productivity: Enable employees to track their progress and make data-driven decisions.
Automation Benefits

Integrating automation into real-time data visualization on corporate signs eliminates manual updates, guaranteeing timely and accurate information delivery. By leveraging automation, you can significantly decrease the need for manual intervention, saving both time and operational costs. This streamlined process guarantees that your digital signage consistently displays relevant content that is up-to-date and precise.
Automation benefits extend beyond just efficiency. Real-time content for digital signs means your data won't become outdated, maintaining continuous relevance and enhancing productivity. By delivering targeted real-time data, you guarantee that the right audience receives the right information at the right moment, boosting team efficiency and improving decision-making processes.
Here's a closer look at the key automation benefits:
| Benefit | Description |
|---|---|
| Time Savings | Eliminates manual updates, freeing up valuable time for other critical tasks. |
| Cost Efficiency | Reduces operational costs associated with manual data management. |
| Data Relevance | Ensures continuous relevance of displayed content, preventing outdated data. |
| Enhanced Productivity | Targeted delivery of information boosts team efficiency and decision-making. |
Integration With Visualization Tools
Seamless integration with visualization tools like Tableau and Microsoft Power BI significantly enhances the data visualization capabilities of corporate signs. By leveraging these tools, you can guarantee that real-time data updates are displayed instantly, providing up-to-the-minute insights. These platforms enhance data storytelling, making complex data more accessible and engaging.
Using visualization tools comes with several advantages:
- Real-time updates: Data changes are immediately reflected on corporate signs, guaranteeing information is always current.
- Enhanced storytelling: Compelling visuals simplify complex data, making it easier for the audience to grasp key insights.
- Ease of understanding: Integration simplifies the process of translating complex datasets into easily digestible formats.
- Accuracy and relevance: Data shown on corporate signs is always accurate and pertinent, thanks to seamless syncing with your data sources.
- Visual appeal: Professionally designed visuals enhance the overall appearance and effectiveness of your corporate signs.
These tools streamline the integration process, making it easier to deploy sophisticated data visualizations on corporate signs. This not only boosts the visual appeal but also guarantees that the data presented is both accurate and relevant. By utilizing these technologies, you can transform your corporate signs into powerful communication tools that convey real-time information effectively.
Frequently Asked Questions
How to Visualize Real-Time Data?
To visualize real-time data, use tools like Tableau or Microsoft Power BI. Connect your data sources, create dynamic dashboards, and automate updates. Confirm the visualizations are clear and actionable to enhance decision-making and communication.
What Is a Data Visualization Tool That Updates in Real Time?
Sprinklr Display updates instantly, capturing data from 30+ digital channels. With 40+ design widgets, it transforms real-time content into impactful visuals. Integration with Tableau and Power BI enhances its capabilities, making it an excellent choice.
How to Make a Realtime Dashboard?
To make a real-time dashboard, integrate live data feeds, choose a tool supporting real-time updates, and add interactive elements like filters. Monitor performance continuously to enable agile decision-making and drive business growth.
What Is the Golden Rule of Data Visualization?
The golden rule of data visualization is to simplify complex data into clear, concise visuals. You should focus on enhancing understanding by avoiding clutter and using strategic design elements like color and layout to highlight key insights.
Conclusion
You might worry about the complexity of implementing real-time data visualization on corporate signs, but the benefits far outweigh the challenges. By integrating visualization tools and leveraging automation, you'll create engaging, insights-driven experiences that captivate audiences and drive business value. Protect data visualizations guarantee your information remains protected. The importance of real-time data can't be overstated—it transforms workplace digital signage into a powerful tool for storytelling and audience engagement, all while streamlining operations.
